Log Center
Centralised debugging and log visibility for Card Suite
A self-service debugging portal built into Zeta's Admin Suite giving FIS and FI admins full visibility into API failures, with powerful filtering and actionable insights to resolve issues faster, without escalating to engineering.
FIS* is one of the backbone companies powering banks and payments globally (you don’t see them, but a lot runs on them).
The video may take a few seconds to load and shows a simulation of locating an error log.
Impact
Turning hours of debugging into minutes

The Problem
No visibility, no velocity
The existing Card Suite tooling left admins flying blind. When an API failure occurred, there was no unified view of logs — data was siloed, filtering was minimal, and context was absent. Every incident turned into a manual hunt.
On average, developers and FI admins spent 3.5 hours per incident just locating the relevant logs before any actual resolution had even begun. ~65% of incidents required escalation to engineering. FI partner NPS was at 54 and trending downward.
Key personas

Leading question
How might we empower FI and FIS admin users to self-serve debugging, reduce dependency on engineering, and improve time-to-resolve for API integration issues?

Our Solution
Core Features
Four pillars of the Log Center
01
Progressive filtering and search
Four primary filters — date/time range, Entity ID, UUID, and PAN — are surfaced upfront to keep the UI lean. Advanced filters (username, URI, HTTP method, integration type, FI name, status code) live behind an expandable panel. As filters are applied, a live count preview shows how many results will return — helping users refine before committing. Primary filters persist across sessions so frequent users don't lose context. A "quick reset vs full reset" pattern was introduced after testing revealed users were accidentally clearing all context.


02
Colour-coded API log results
Results surface only failed logs (4xx, 5xx) in a paginated table — showing timestamp, URI, status code, UUID, Entity ID, FI, and integration type. Status codes are colour-coded for instant scanability: 89% of users in testing said they could spot failures in 1–2 seconds. Logs are retained on a 15-day rolling window with pagination from 200 up to 500 rows per page.

03
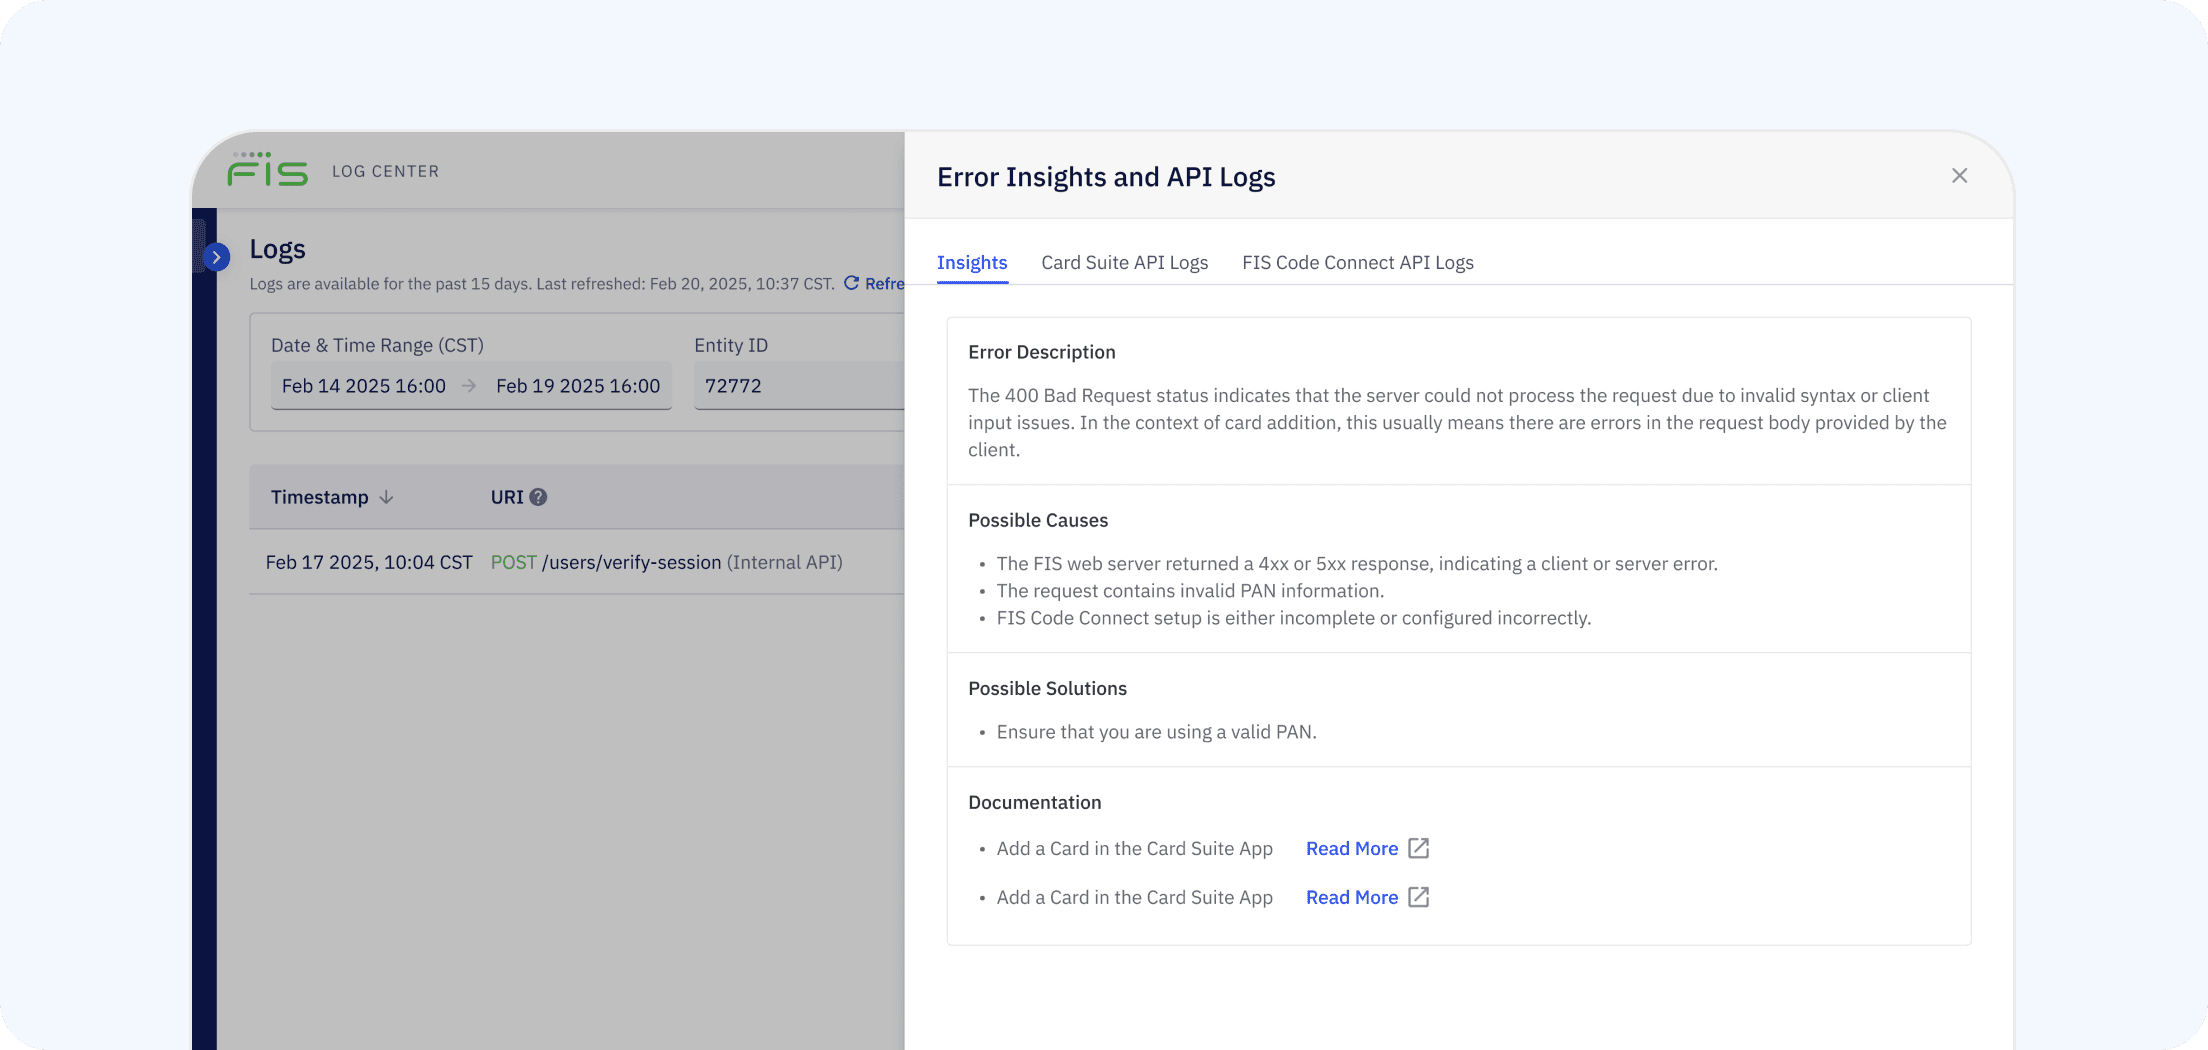
Contextual insights per error
Selecting any log entry opens a "View Details" panel surfacing contextual intelligence — an error description scoped to the relevant Card Suite module, a list of possible causes, suggested remedies, and direct documentation links. This content is managed by product and content teams with no engineering dependency, ensuring it stays accurate and evolves with the product.
04
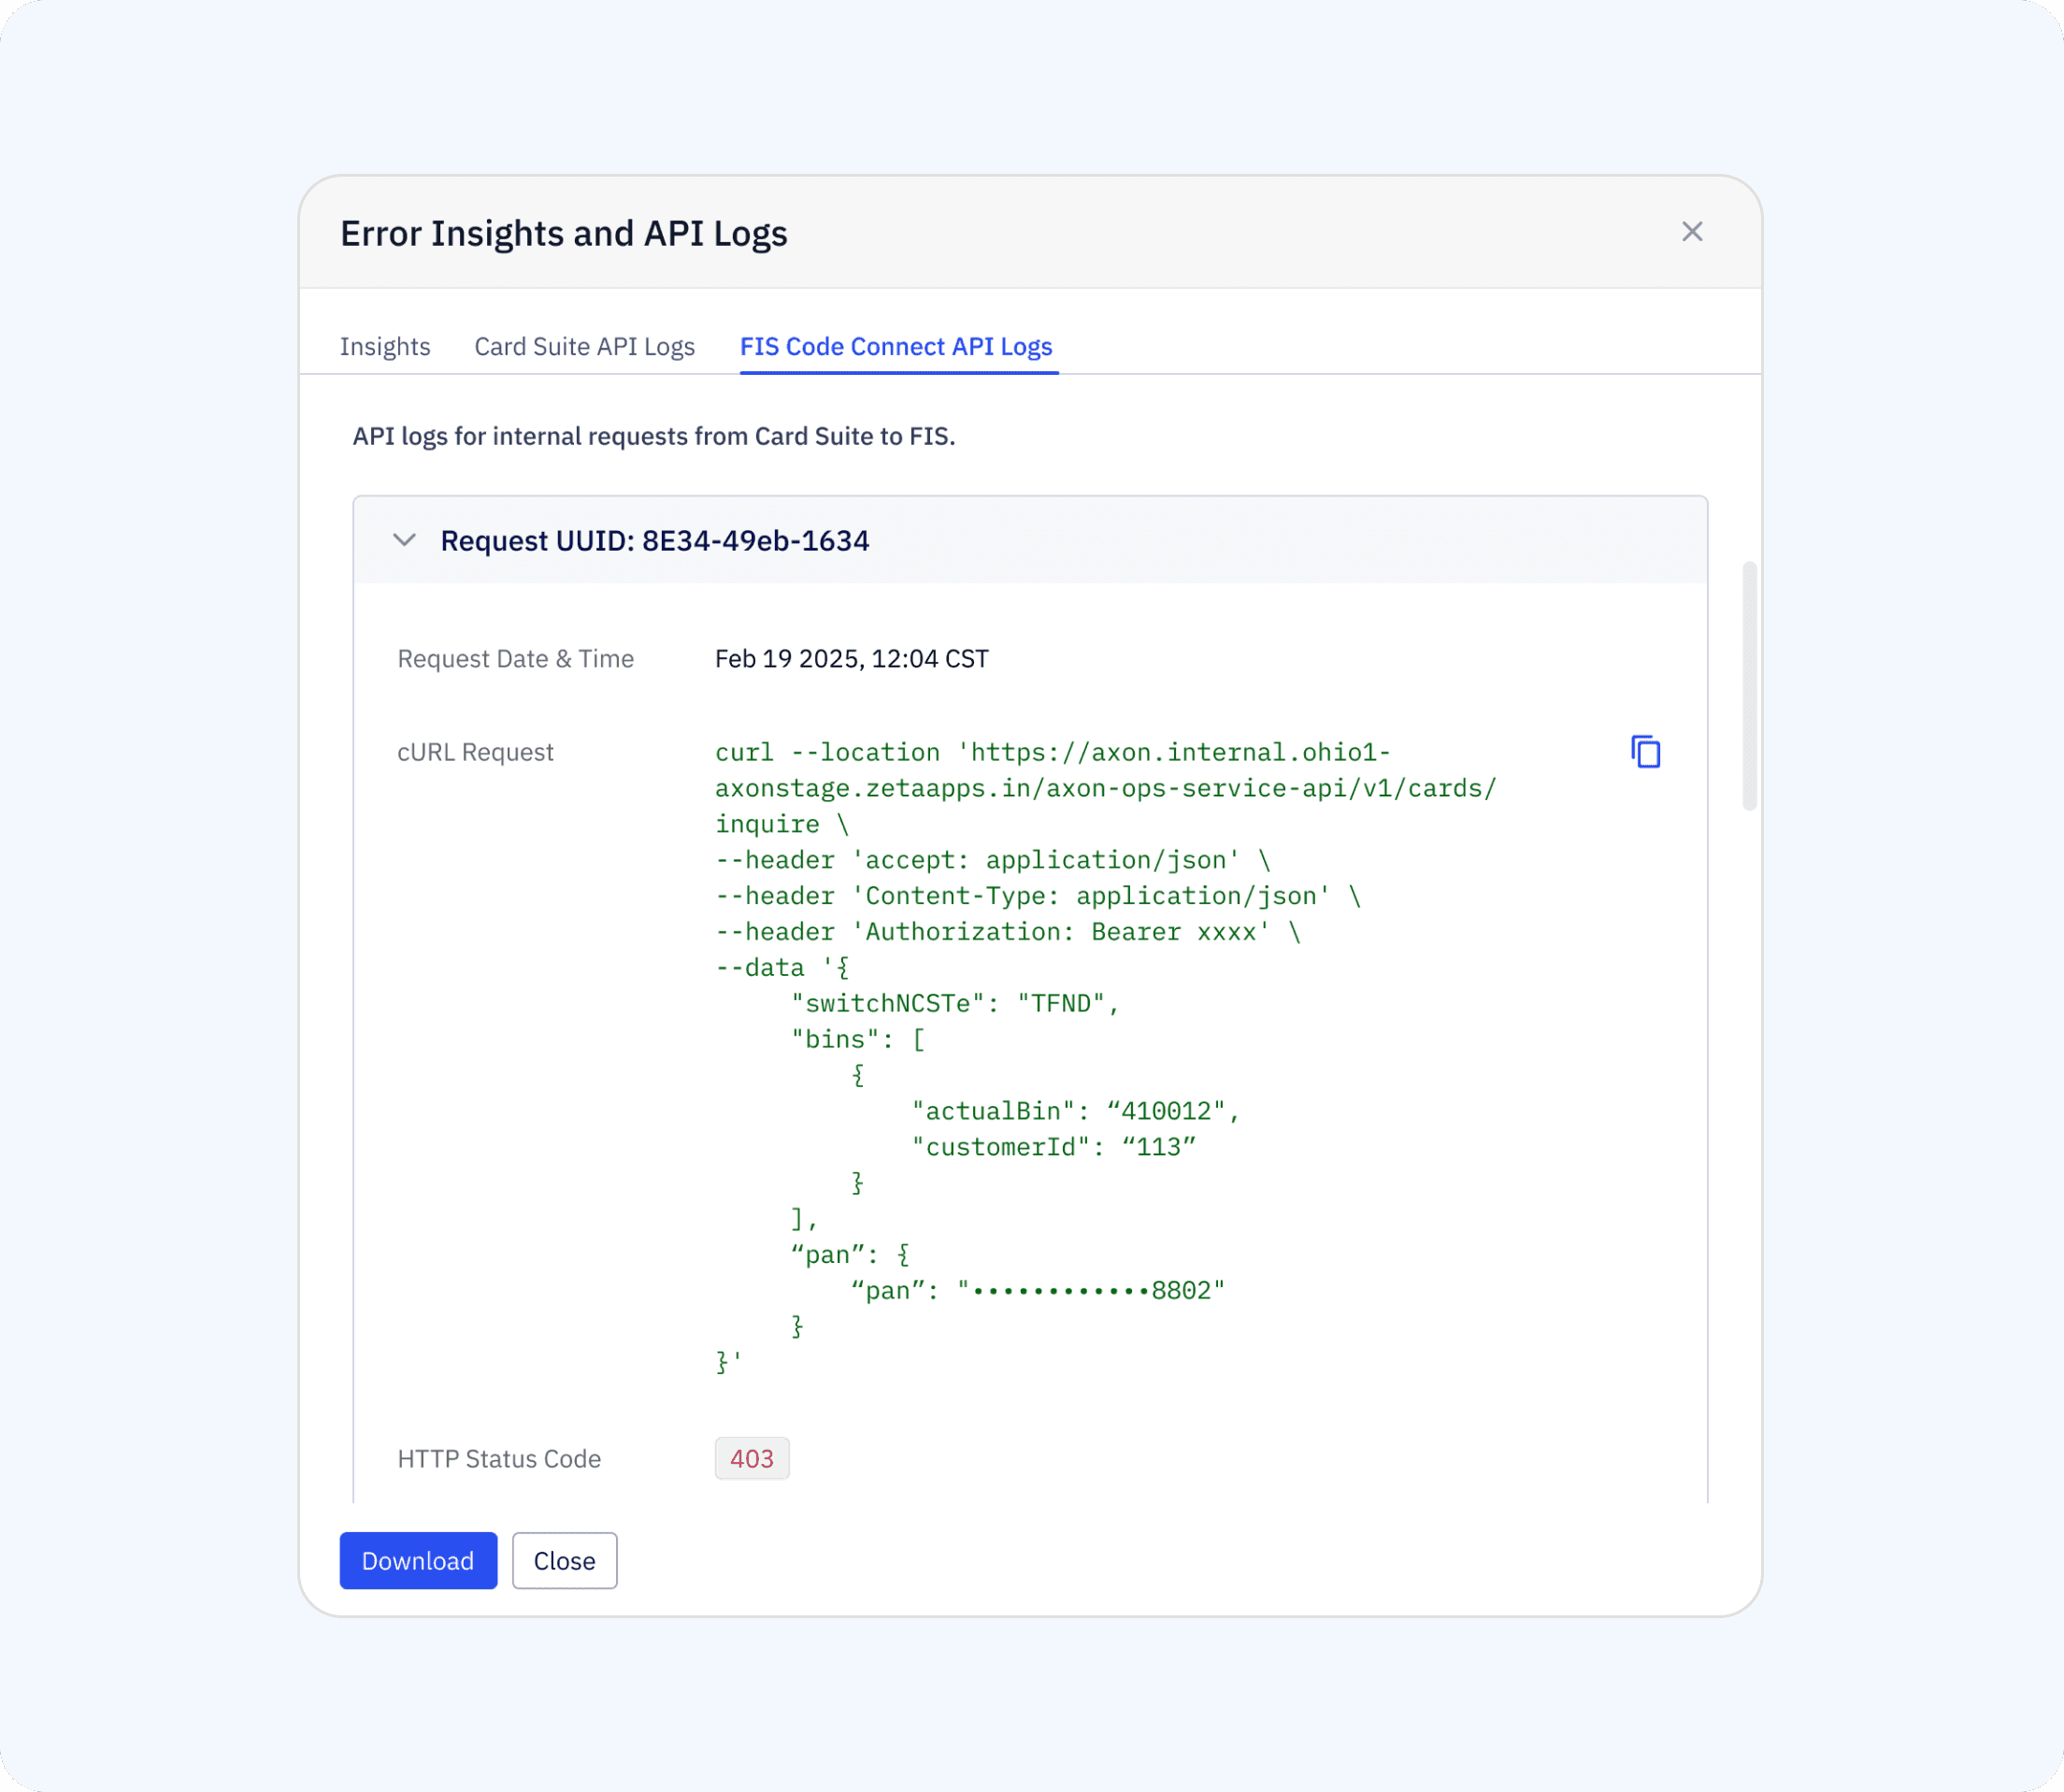
Dual log view with download
Each entry exposes two log panels — Card Suite API Logs (inbound calls to Card Suite) and FIS Code Connect API Logs (outbound calls to FIS). Both include request timestamp, UUID, cURL request with copy option, response code, and response body. Logs can be downloaded as .docx files with standardised filenames (e.g. CardSuiteLogs_EntityID_Timestamp.docx) — 43% of testers said they immediately export logs to attach to escalation tickets. Edge cases — where one log succeeds and the other errors — are handled with specific UI states.
Design Decisions
Trade-offs we made consciously

Challenges
What made this hard
Performance at scale
Querying 500K+ log entries caused latency. Resolved with backend pagination and caching strategies.
Access complexity
Multiple overlapping roles (FIS Admin, FI Admin, Zeta Admin) and co-mingled BINs required a detailed role matrix and explicit "no access" UI states.
Data sensitivity vs visibility
Showing enough context to debug while masking PII required close collaboration with the security team.
Outcomes
Hours of debugging reduced to minutes
The Log Center directly addressed the 3.5-hour per-incident bottleneck by giving admins a single, filtered view of failed API logs with contextual remediation guidance. Engineering escalations dropped as FI admins could self-serve the majority of debugging tasks. The colour-coded results table — with 89% instant-recognition accuracy in testing — became the primary interface for incident response across Card Suite.
duttadebankur@gmail.com • +91 93542 72977